Playa Blanca Climate by Month
Playa Blanca has a steady warm climate throughout the year.
It is also known for its large amounts of rainfall.
Let’s explore the climate details in depth to provide you with a complete overview.
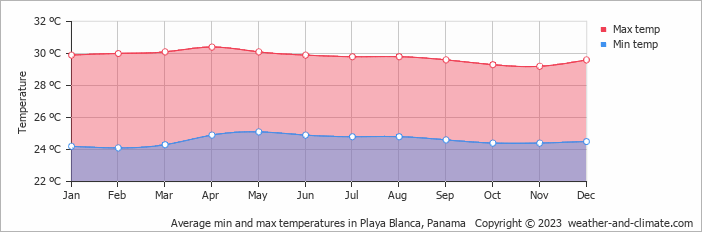
Average day and night temperature
The climate in Playa Blanca remains fairly constant, offering comfortable temperatures throughout the year. Typically, daytime temperatures range from a very warm 30°C in April to a comfortable 29°C in the coolest month, February. Nights are cooler, with temperatures generally dropping to 24°C, particularly during the colder months.
The mean minimum and maximum temperatures throughout the year
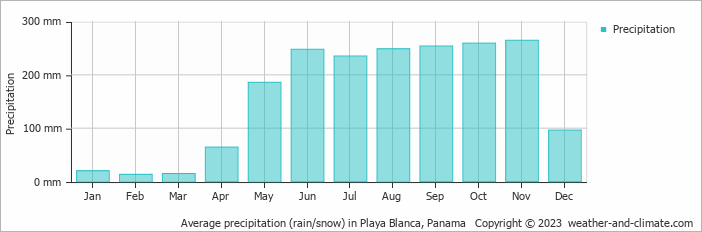
Precipitation and rainy days
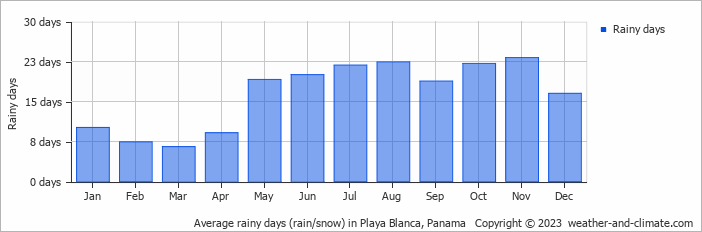
Playa Blanca is known for its substantial rainfall, with annual precipitation reaching 1902 mm. The climate in Playa Blanca shows significant variation throughout the year. Expect heavy rainfall in November, with an average of 265 mm of precipitation over 23 rainy days. In contrast, February offers drier and sunnier days, with around 13 mm of rainfall over 7 rainy days.The mean monthly precipitation over the year, including rain, hail and snow
The average number of days each month with precipitation
The best time of year to visit Playa Blanca in Panama
Playa Blanca has high temperatures year round ranging between 29°C and 30°C.The best time to visit is during the drier months: January, February and March.
Other facts from our historical weather data:
Yes, the months of January, February and March are very dry.
April has an average maximum temperature of 30°C and is the hottest month of the year.
The coolest month is February with an average maximum temperature of 29°C.
November tops the wettest month list with 265 mm of rainfall.
February is the driest month with 13 mm of precipitation.
No idea where to travel to this year? We have a tool that recommends destinations based on your ideal conditions. Find out where to go with our weather planner.