ClimateForecastAprilMay >>

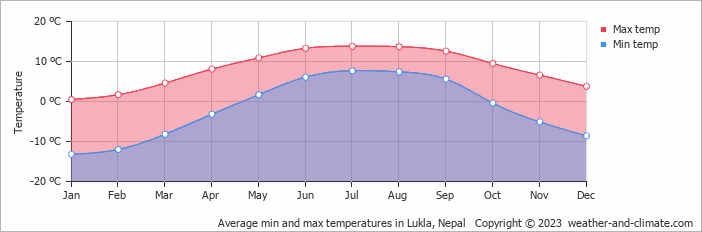
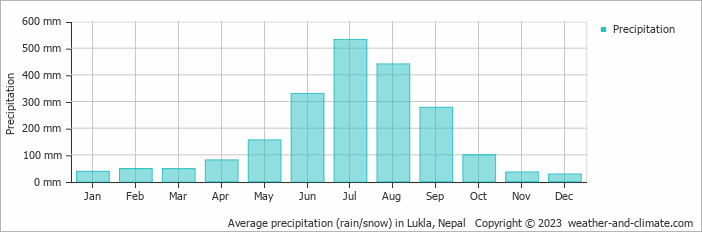
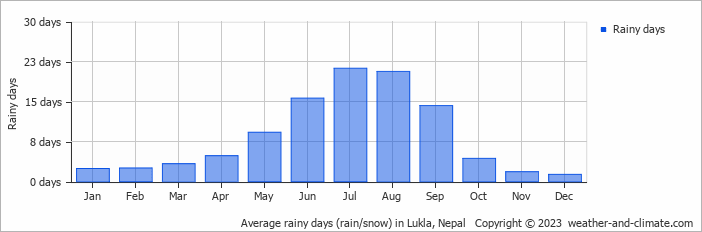
Climate in Lukla, Nepal

The graphs below show the monthly weather averages over the year.

Average day and night temperature

The mean minimum and maximum temperatures over the year.

Average monthly minimum and maximum temperature in Lukla, Nepal

Feel free to add this climate graph to your website. Click the copy button above.

Monthly precipitation

The mean monthly precipitation over the year, including rain, snow, hail etc.

Average monthly rainfall, snow, precipitation in Lukla, Nepal

Feel free to add this climate graph to your website. Click the copy button above.

Monthly rainy days

The average number of days each month with rain, snow, hail etc.

Average monthly rainy days in Lukla, Nepal

Feel free to add this climate graph to your website. Click the copy button above.

Weather Forecasts for Lukla

Fri   Apr 19
10°C | 3°C
S 4 km/h
2.8 mm
broken clouds and  chance of rain

broken clouds and chance of rain

Sat   Apr 20
10°C | 4°C
S 7 km/h
2.9 mm
partly cloudy and  chance of rain

partly cloudy and chance of rain

Sun   Apr 21
10°C | 3°C
S 7 km/h
0.3 mm
partly cloudy and  chance of slight rain

partly cloudy and chance of slight rain

The best time of year to visit Lukla in Nepal

Other facts from our historical weather data:

  • When is the rainy season in Lukla?
    Rainy season in Lukla occurs in the months of May, June, July, August and September.
  • Which is the warmest month in Lukla?
    July has an average maximum temperature of 14°C and is the warmest month of the year.
  • Which is the coldest month in Lukla?
    The coldest month is January with an average maximum temperature of 1°C.
  • Which is the wettest month in Lukla?
    July tops the wettest month list with 532 mm of rainfall.
  • Which is the driest month in Lukla?
    December is the driest month with 27 mm of precipitation.

  • No idea where to travel to this year? We have a tool that recommends destinations based on your ideal conditions. Find out where to go with our weather planner.