Climate in Koh Chang (Koh Chang), Thailand

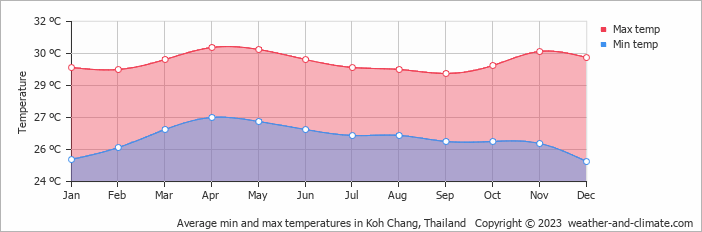
The graphs below show the monthly weather averages over the year.

Average day and night temperature

The mean minimum and maximum temperatures over the year.

Average monthly minimum and maximum temperature in Koh Chang, Thailand

Feel free to add this climate graph to your website. Click the copy button above.

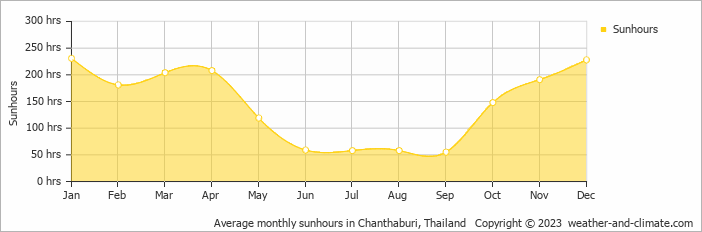
Monthly hours of sunshine

The average monthly total hours of sunshine over the year

Average monthly hours of sunshine in Koh Chang, Thailand

Feel free to add this climate graph to your website. Click the copy button above.

* Data from: Chanthaburi, Thailand (66 KM, 41 Miles).

Monthly precipitation

The mean monthly precipitation over the year, including rain, snow, hail etc.

Average monthly rainfall, snow, precipitation in Koh Chang, Thailand

Feel free to add this climate graph to your website. Click the copy button above.

Monthly rainy days

The average number of days each month with rain, snow, hail etc.

Average monthly rainy days in Koh Chang, Thailand

Feel free to add this climate graph to your website. Click the copy button above.

Average humidity

The mean monthly relative humidity over the year

Average monthly relative humidity in Koh Chang, Thailand

Feel free to add this climate graph to your website. Click the copy button above.

* Data from: Chanthaburi, Thailand (66 KM, 41 Miles).

Weather Forecasts for Koh Chang

Tue   Mar 19
31°C | 26°C
SW 14 km/h
4.6 mm
partly cloudy and rain

partly cloudy and rain

Wed   Mar 20
31°C | 24°C
W 14 km/h
4.3 mm
partly cloudy and rain

partly cloudy and rain

Thu   Mar 21
31°C | 25°C
SW 14 km/h
2.1 mm
partly cloudy and rain

partly cloudy and rain

The best time of year to visit Koh Chang in Thailand

Koh Chang has high temperatures year round ranging between 29°C and 30°C.
The best time to visit is during the drier months: January, February and December.

Other facts from our historical weather data:

  • When is the rainy season in Koh Chang?
    Rainy season in Koh Chang occurs in the months of May, June, July, August, September and October.
  • Which is the hottest month in Koh Chang?
    April has an average maximum temperature of 31°C and is the hottest month of the year.
  • Which is the coolest month in Koh Chang?
    The coolest month is December with an average maximum temperature of 29°C.
  • Which is the wettest month in Koh Chang?
    July tops the wettest month list with 623 mm of rainfall.
  • Which is the driest month in Koh Chang?
    December is the driest month with 20 mm of precipitation.
  • Which is the sunniest month in Koh Chang?
    January is the sunniest month with an average of 231 hours of sunshine.

  • No idea where to travel to this year? We have a tool that recommends destinations based on your ideal conditions. Find out where to go with our weather planner.