ClimateForecastAprilMay >>

Climate in Harboør (Midtjylland), Denmark

The graphs below show the monthly weather averages over the year.

Average day and night temperature

The mean minimum and maximum temperatures over the year.

Average monthly minimum and maximum temperature in Harboør, Denmark

Feel free to add this climate graph to your website. Click the copy button above.

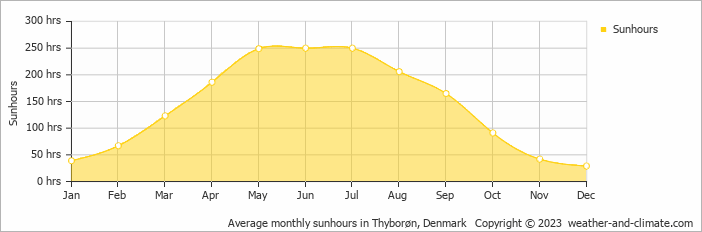
Monthly hours of sunshine

The average monthly total hours of sunshine over the year

Average monthly hours of sunshine in Harboør, Denmark

Feel free to add this climate graph to your website. Click the copy button above.

* Data from: Thyborøn, Denmark (9 KM, 5 Miles).

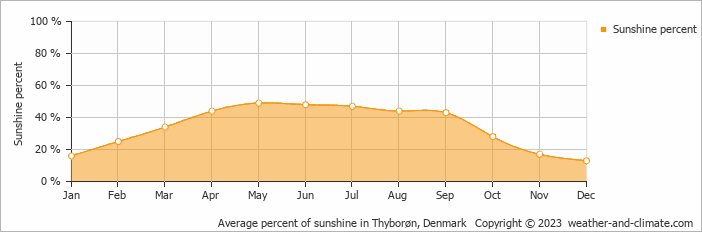
Daily percent of sunshine

The mean percent of hours of sunhours during the day over the year

Average monthly percentage of sunshine in Harboør, Denmark

Feel free to add this climate graph to your website. Click the copy button above.

* Data from: Thyborøn, Denmark (9 KM, 5 Miles).

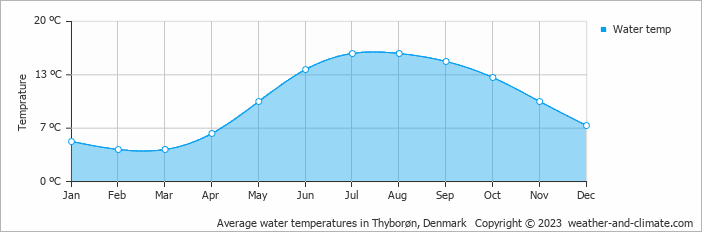
Average water temperature

The mean water temperature over the year.
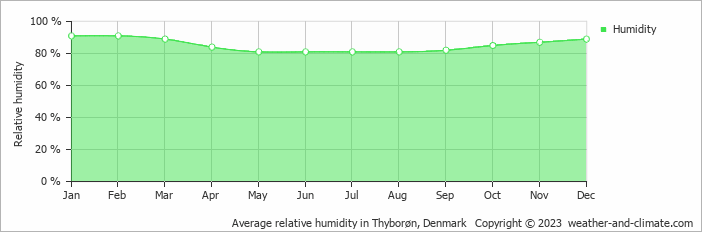
Average monthly water temperature in Harboør, Denmark

Feel free to add this climate graph to your website. Click the copy button above.

* Data from: Thyborøn, Denmark (9 KM, 5 Miles).

Monthly precipitation

The mean monthly precipitation over the year, including rain, snow, hail etc.

Average monthly rainfall, snow, precipitation in Harboør, Denmark

Feel free to add this climate graph to your website. Click the copy button above.

Monthly rainy days

The average number of days each month with rain, snow, hail etc.

Average monthly rainy days in Harboør, Denmark

Feel free to add this climate graph to your website. Click the copy button above.

Average humidity

The mean monthly relative humidity over the year
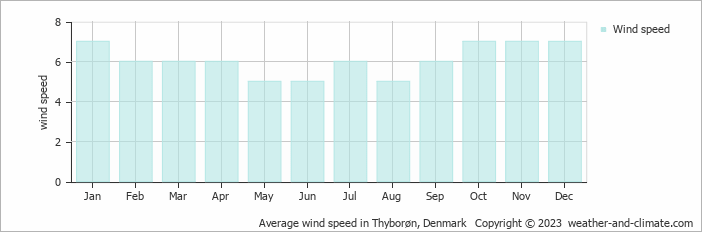
Average monthly relative humidity in Harboør, Denmark

Feel free to add this climate graph to your website. Click the copy button above.

* Data from: Thyborøn, Denmark (9 KM, 5 Miles).

Average wind speed

The mean monthly wind speed over the year (in meters per second)

Average monthly wind speed in Harboør, Denmark

Feel free to add this climate graph to your website. Click the copy button above.

* Data from: Thyborøn, Denmark (9 KM, 5 Miles).

Weather Forecasts for Harboør

Fri   Apr 19
8°C | 4°C
NE 32 km/h
1.9 mm
partly cloudy and slight rain

partly cloudy and slight rain

Sat   Apr 20
8°C | 4°C
NW 18 km/h
partly cloudy and no rain

partly cloudy and no rain

Sun   Apr 21
9°C | 5°C
N 25 km/h
almost clear and no rain

almost clear and no rain

The best time of year to visit Harboør in Denmark

Other facts from our historical weather data:

  • Which is the warmest month in Harboør?
    August has an average maximum temperature of 20°C and is the warmest month of the year.
  • Which is the coldest month in Harboør?
    The coldest month is February with an average maximum temperature of 5°C.
  • Which is the wettest month in Harboør?
    October tops the wettest month list with 114 mm of rainfall.
  • Which is the driest month in Harboør?
    April is the driest month with 52 mm of precipitation.
  • Which is the sunniest month in Harboør?
    July is the sunniest month with an average of 250 hours of sunshine.

  • No idea where to travel to this year? We have a tool that recommends destinations based on your ideal conditions. Find out where to go with our weather planner.