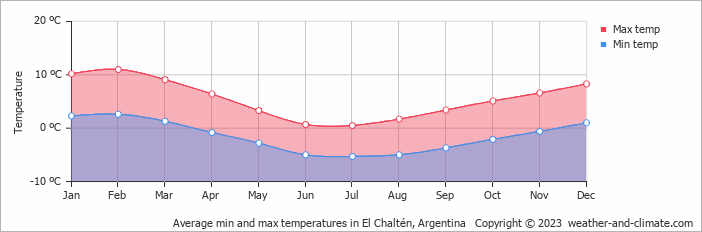
Climate in El Chaltén (Santa Cruz, Argentina)

The graphs below show the monthly weather averages over the year.

Average day and night temperature

The mean minimum and maximum temperatures over the year. Show in Celsius

Average min and max temperatures in El Chaltén, Argentina   Copyright © 2023  weather-and-climate.com

Feel free to add this climate graph to your website. Click the copy button above.

Monthly hours of sunshine

The average monthly total hours of sunshine over the year

Average monthly sunhours in El Chaltén, Argentina   Copyright © 2023  weather-and-climate.com

Feel free to add this climate graph to your website. Click the copy button above.

Monthly precipitation

The mean monthly precipitation over the year, including rain, snow, hail etc. Show in Millimeter

Average precipitation (rain/snow) in El Chaltén, Argentina   Copyright © 2023  weather-and-climate.com

Feel free to add this climate graph to your website. Click the copy button above.

Monthly rainy days

The average number of days each month with rain, snow, hail etc.

Average rainy days (rain/snow) in El Chaltén, Argentina   Copyright © 2023  weather-and-climate.com

Feel free to add this climate graph to your website. Click the copy button above.

Weather Forecasts for El Chaltén (Santa Cruz)

Sun   Dec 10
52°F | 37°F
N 7 mph
1.5 inches
overcast and heavy rain

overcast and heavy rain

Mon   Dec 11
52°F | 36°F
NW 9 mph
broken clouds and no rain

broken clouds and no rain

Tue   Dec 12
52°F | 37°F
N 11 mph
0.2 inches
overcast and rain

overcast and rain

The best time of year to visit El Chaltén in Argentina

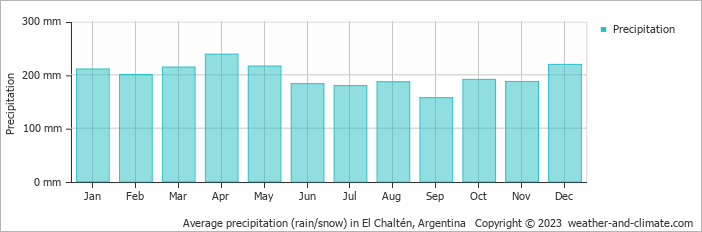
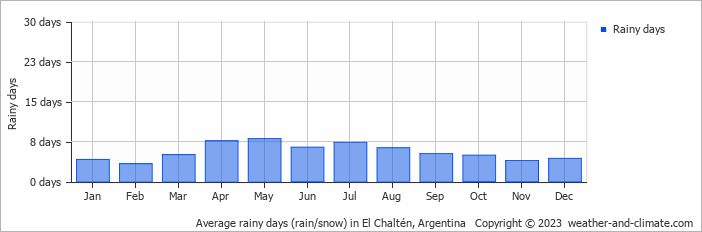
The average rainfall figures in El Chaltén are quite high. Throughout the year, you have a chance of prolonged precipitation. So no matter what time of year you go, you will always have to deal with a high number of rainy days. This makes it more challenging to point out the best time of year to visit. 
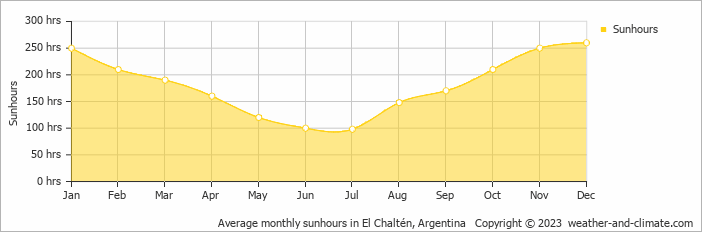
If we needed to pick one month we would choose December which is the sunniest month of the year.

Other facts from our historical weather data:

  • When is winter in El Chaltén?
    The coldest season / winter is in the following months: June, July and August.
  • Which is the warmest month in El Chaltén?
    February has an average maximum temperature of 11°C (52°F) and is the warmest month of the year.
  • Which is the coldest month in El Chaltén?
    The coldest month is July with an average maximum temperature of 1°C (33°F).
  • Which is the wettest month in El Chaltén?
    April tops the wettest month list with 239mm (9.4in) of rainfall.
  • Which is the driest month in El Chaltén?
    September is the driest month with 157mm (6.2in) of precipitation.
  • Which is the sunniest month in El Chaltén?
    December is the sunniest month with an average of 260 hours of sunshine.

  • No idea where to travel to this year? We have a tool that recommends destinations based on your ideal conditions. Find out where to go with our weather planner.