ClimateForecastAprilMay >>

Climate in Durango City (Durango), Mexico

The graphs below show the monthly weather averages over the year.

Average day and night temperature

The mean minimum and maximum temperatures over the year.

Average monthly minimum and maximum temperature in Durango City, Mexico

Feel free to add this climate graph to your website. Click the copy button above.

Monthly hours of sunshine

The average monthly total hours of sunshine over the year

Average monthly hours of sunshine in Durango City, Mexico

Feel free to add this climate graph to your website. Click the copy button above.

Monthly precipitation

The mean monthly precipitation over the year, including rain, snow, hail etc.

Average monthly rainfall, snow, precipitation in Durango City, Mexico

Feel free to add this climate graph to your website. Click the copy button above.

Monthly rainy days

The average number of days each month with rain, snow, hail etc.

Average monthly rainy days in Durango City, Mexico

Feel free to add this climate graph to your website. Click the copy button above.

Average humidity

The mean monthly relative humidity over the year

Average monthly relative humidity in Durango City, Mexico

Feel free to add this climate graph to your website. Click the copy button above.

Weather Forecasts for Durango City

Fri   Apr 19
35°C | 13°C
SW 22 km/h
clear and no rain

clear and no rain

Sat   Apr 20
34°C | 13°C
SW 18 km/h
clear and no rain

clear and no rain

Sun   Apr 21
33°C | 11°C
NE 7 km/h
clear and no rain

clear and no rain

The best time of year to visit Durango City in Mexico

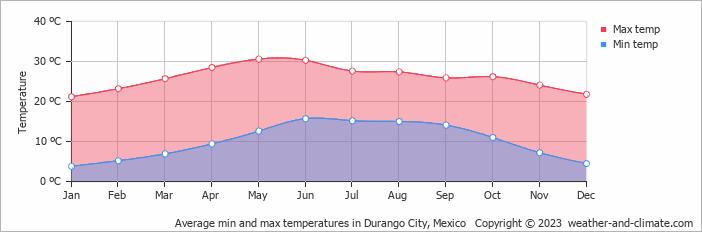
During the months of January, February, March, September, November and December you are most likely to experience good weather with pleasant average temperatures that fall between 20°C and 26°C.

Other facts from our historical weather data:

  • Which is the warmest month in Durango City?
    May has an average maximum temperature of 31°C and is the warmest month of the year.
  • Which is the coldest month in Durango City?
    The coldest month is January with an average maximum temperature of 21°C.
  • Which is the wettest month in Durango City?
    September tops the wettest month list with 124 mm of rainfall.
  • Which is the driest month in Durango City?
    April is the driest month with 6 mm of precipitation.
  • Which is the sunniest month in Durango City?
    May is the sunniest month with an average of 301 hours of sunshine.

  • No idea where to travel to this year? We have a tool that recommends destinations based on your ideal conditions. Find out where to go with our weather planner.