ClimateForecastAprilMay >>

Climate in Ciudad de Malabo, Equatorial Guinea

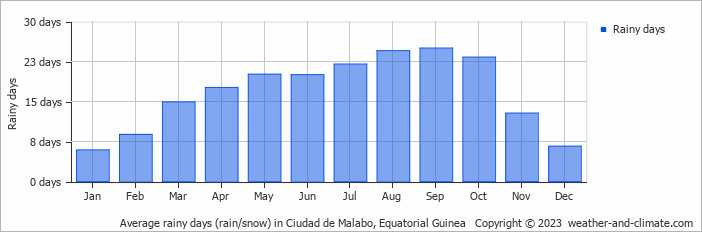
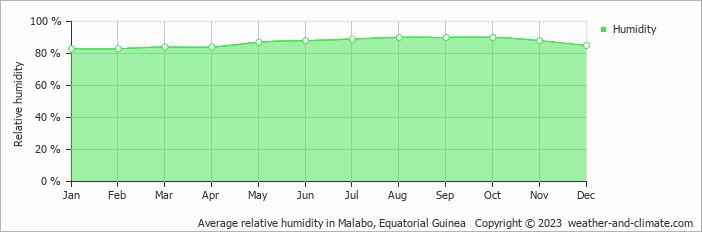
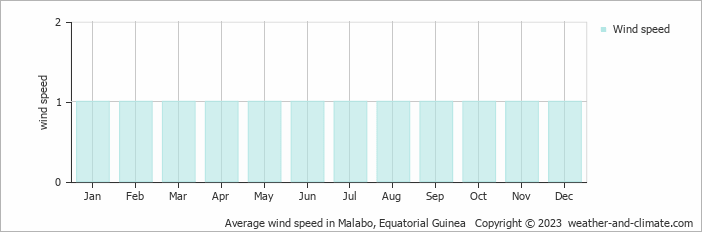
The graphs below show the monthly weather averages over the year.

Average day and night temperature

The mean minimum and maximum temperatures over the year.

Average monthly minimum and maximum temperature in Ciudad de Malabo, Equatorial Guinea

Feel free to add this climate graph to your website. Click the copy button above.

Monthly hours of sunshine

The average monthly total hours of sunshine over the year

Average monthly hours of sunshine in Ciudad de Malabo, Equatorial Guinea

Feel free to add this climate graph to your website. Click the copy button above.


Daily percent of sunshine

The mean percent of hours of sunhours during the day over the year

Average monthly percentage of sunshine in Ciudad de Malabo, Equatorial Guinea

Feel free to add this climate graph to your website. Click the copy button above.


Monthly precipitation

The mean monthly precipitation over the year, including rain, snow, hail etc.

Average monthly rainfall, snow, precipitation in Ciudad de Malabo, Equatorial Guinea

Feel free to add this climate graph to your website. Click the copy button above.

Monthly rainy days

The average number of days each month with rain, snow, hail etc.

Average monthly rainy days in Ciudad de Malabo, Equatorial Guinea

Feel free to add this climate graph to your website. Click the copy button above.

Average humidity

The mean monthly relative humidity over the year

Average monthly relative humidity in Ciudad de Malabo, Equatorial Guinea

Feel free to add this climate graph to your website. Click the copy button above.


Average wind speed

The mean monthly wind speed over the year (in meters per second)

Average monthly wind speed in Ciudad de Malabo, Equatorial Guinea

Feel free to add this climate graph to your website. Click the copy button above.


Weather Forecasts for Ciudad de Malabo

Fri   Apr 19
32°C | 26°C
W 11 km/h
1.9 mm
broken clouds and  chance of rain

broken clouds and chance of rain

Sat   Apr 20
33°C | 26°C
W 14 km/h
0.7 mm
broken clouds and  chance of rain

broken clouds and chance of rain

Sun   Apr 21
32°C | 26°C
NW 14 km/h
7.5 mm
broken clouds and thunder

broken clouds and thunder

The best time of year to visit Ciudad de Malabo in Equatorial Guinea

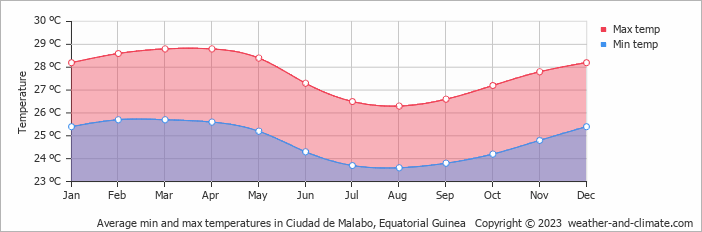
Ciudad de Malabo has high temperatures year round ranging between 26°C and 28°C.
Other facts from our historical weather data:

  • Which is the warmest month in Ciudad de Malabo?
    March has an average maximum temperature of 29°C and is the warmest month of the year.
  • Which is the coldest month in Ciudad de Malabo?
    The coldest month is August with an average maximum temperature of 26°C.
  • Which is the wettest month in Ciudad de Malabo?
    July tops the wettest month list with 454 mm of rainfall.
  • Which is the driest month in Ciudad de Malabo?
    January is the driest month with 61 mm of precipitation.
  • Which is the sunniest month in Ciudad de Malabo?
    February is the sunniest month with an average of 125 hours of sunshine.

  • No idea where to travel to this year? We have a tool that recommends destinations based on your ideal conditions. Find out where to go with our weather planner.