Climate in Burgerbrug (Noord-Holland), Netherlands
The graphs below show the monthly weather averages over the year.
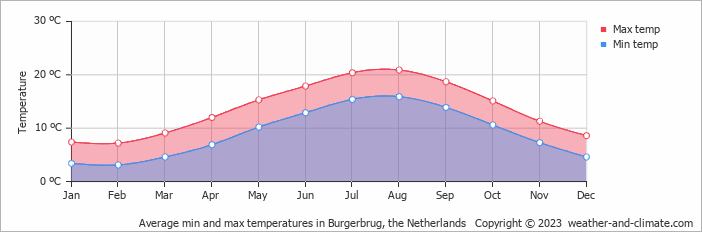
Average day and night temperature
The mean minimum and maximum temperatures over the year.
Monthly hours of sunshine
The average monthly total hours of sunshine over the year
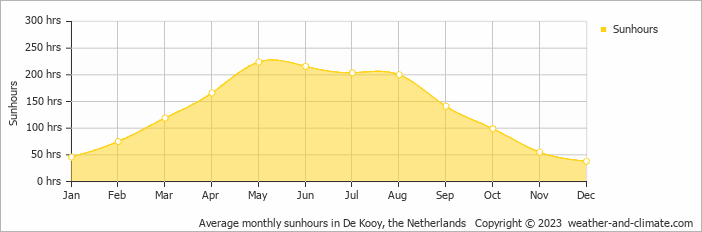
* Data from: De Kooy, the Netherlands (19 KM, 12 Miles).
Daily percent of sunshine
The mean percent of hours of sunhours during the day over the year
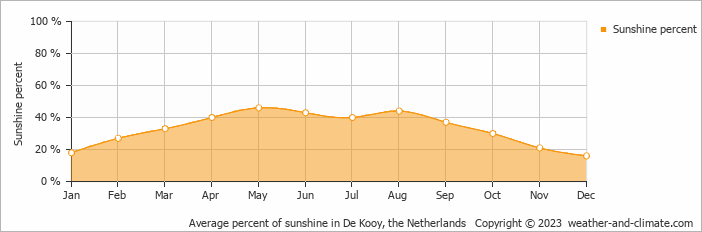
* Data from: De Kooy, the Netherlands (19 KM, 12 Miles).
Average water temperature
The mean water temperature over the year.
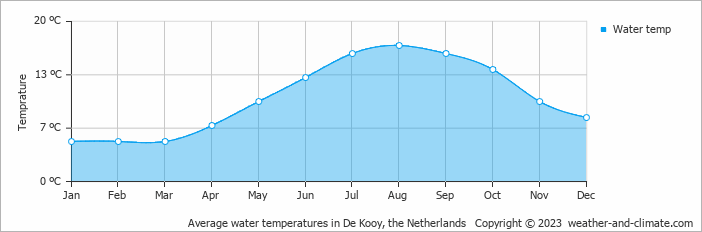
* Data from: De Kooy, the Netherlands (19 KM, 12 Miles).
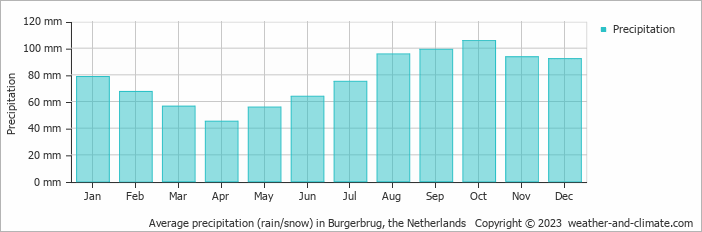
Monthly precipitation
The mean monthly precipitation over the year, including rain, snow, hail etc.
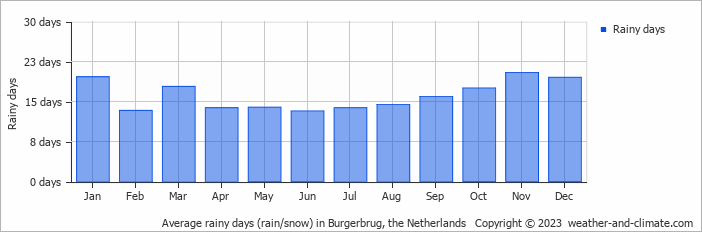
Monthly rainy days
The average number of days each month with rain, snow, hail etc.
Average humidity
The mean monthly relative humidity over the year
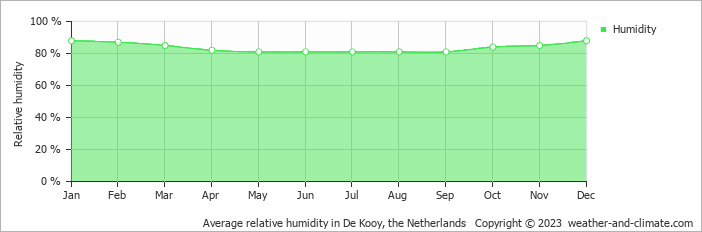
* Data from: De Kooy, the Netherlands (19 KM, 12 Miles).
Average wind speed
The mean monthly wind speed over the year (in meters per second)
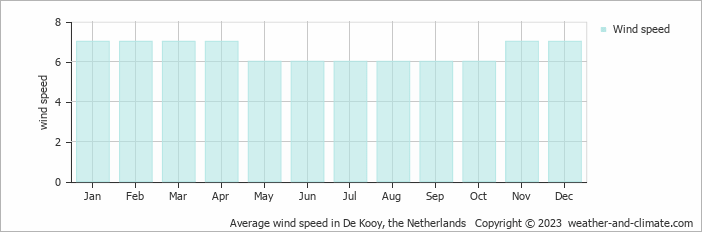
* Data from: De Kooy, the Netherlands (19 KM, 12 Miles).


