ClimateForecastAprilMay >>

Climate in Ban Bang Po (Koh Samui), Thailand

The graphs below show the monthly weather averages over the year.

Average day and night temperature

The mean minimum and maximum temperatures over the year.

Average monthly minimum and maximum temperature in Ban Bang Po, Thailand

Feel free to add this climate graph to your website. Click the copy button above.

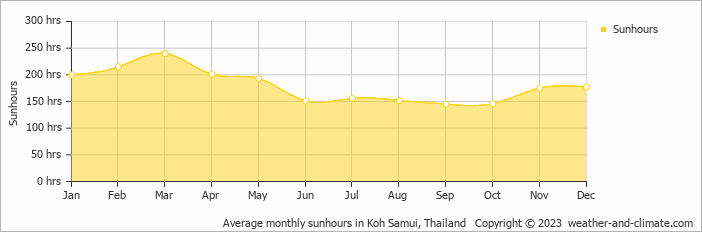
Monthly hours of sunshine

The average monthly total hours of sunshine over the year

Average monthly hours of sunshine in Ban Bang Po, Thailand

Feel free to add this climate graph to your website. Click the copy button above.

* Data from: Koh Samui, Thailand (3 KM, 2 Miles).

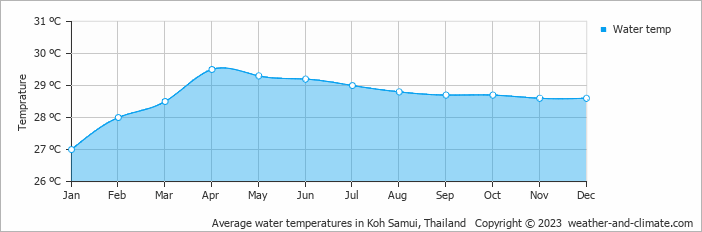
Average water temperature

The mean water temperature over the year.
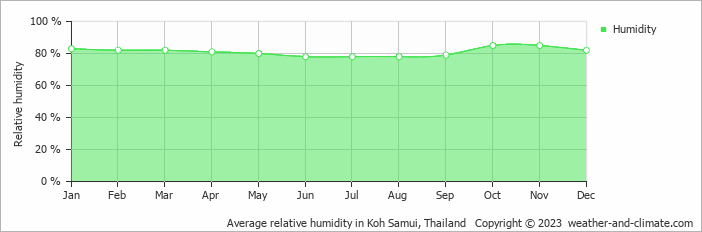
Average monthly water temperature in Ban Bang Po, Thailand

Feel free to add this climate graph to your website. Click the copy button above.

* Data from: Koh Samui, Thailand (3 KM, 2 Miles).

Monthly precipitation

The mean monthly precipitation over the year, including rain, snow, hail etc.

Average monthly rainfall, snow, precipitation in Ban Bang Po, Thailand

Feel free to add this climate graph to your website. Click the copy button above.

Monthly rainy days

The average number of days each month with rain, snow, hail etc.

Average monthly rainy days in Ban Bang Po, Thailand

Feel free to add this climate graph to your website. Click the copy button above.

Average humidity

The mean monthly relative humidity over the year

Average monthly relative humidity in Ban Bang Po, Thailand

Feel free to add this climate graph to your website. Click the copy button above.

* Data from: Koh Samui, Thailand (3 KM, 2 Miles).

Weather Forecasts for Ban Bang Po

Fri   Apr 19
36°C | 28°C
S 7 km/h
almost clear and no rain

almost clear and no rain

Sat   Apr 20
35°C | 28°C
SE 7 km/h
1.5 mm
partly cloudy and  chance of rain

partly cloudy and chance of rain

Sun   Apr 21
36°C | 27°C
W 11 km/h
2 mm
partly cloudy and rain

partly cloudy and rain

The best time of year to visit Ban Bang Po in Thailand

Other facts from our historical weather data:

  • Which months have the greatest rainfall in Ban Bang Po?
    Most rainfall (rainy season) is seen in September, October and November.
  • Which is the hottest month in Ban Bang Po?
    May has an average maximum temperature of 31°C and is the hottest month of the year.
  • Which is the coolest month in Ban Bang Po?
    The coolest month is January with an average maximum temperature of 29°C.
  • Which is the wettest month in Ban Bang Po?
    October tops the wettest month list with 300 mm of rainfall.
  • Which is the driest month in Ban Bang Po?
    February is the driest month with 44 mm of precipitation.
  • Which is the sunniest month in Ban Bang Po?
    March is the sunniest month with an average of 240 hours of sunshine.

  • No idea where to travel to this year? We have a tool that recommends destinations based on your ideal conditions. Find out where to go with our weather planner.