ClimateForecastAprilMay >>

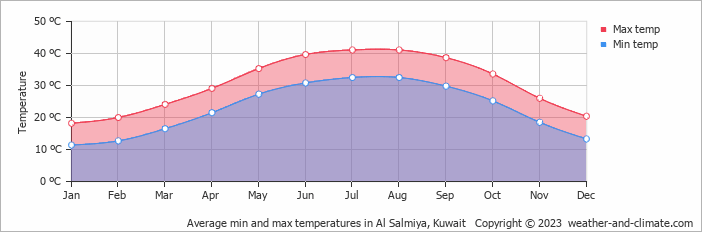
Climate in Al Salmiya, Kuwait

The graphs below show the monthly weather averages over the year.

Average day and night temperature

The mean minimum and maximum temperatures over the year.

Average monthly minimum and maximum temperature in Al Salmiya, Kuwait

Feel free to add this climate graph to your website. Click the copy button above.

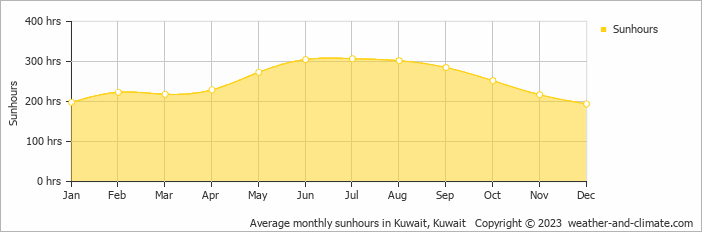
Monthly hours of sunshine

The average monthly total hours of sunshine over the year

Average monthly hours of sunshine in Al Salmiya, Kuwait

Feel free to add this climate graph to your website. Click the copy button above.

* Data from: Kuwait, Kuwait (16 KM, 9 Miles).

Average water temperature

The mean water temperature over the year.
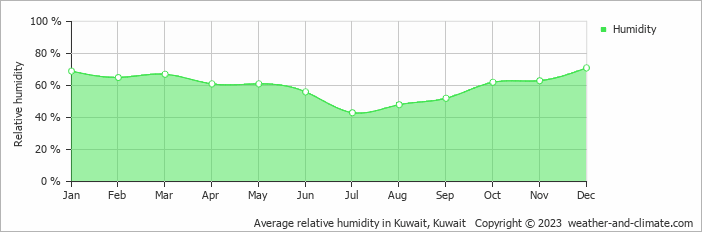
Average monthly water temperature in Al Salmiya, Kuwait

Feel free to add this climate graph to your website. Click the copy button above.

* Data from: Kuwait, Kuwait (16 KM, 9 Miles).

Monthly precipitation

The mean monthly precipitation over the year, including rain, snow, hail etc.

Average monthly rainfall, snow, precipitation in Al Salmiya, Kuwait

Feel free to add this climate graph to your website. Click the copy button above.

Monthly rainy days

The average number of days each month with rain, snow, hail etc.

Average monthly rainy days in Al Salmiya, Kuwait

Feel free to add this climate graph to your website. Click the copy button above.

Average humidity

The mean monthly relative humidity over the year

Average monthly relative humidity in Al Salmiya, Kuwait

Feel free to add this climate graph to your website. Click the copy button above.

* Data from: Kuwait, Kuwait (16 KM, 9 Miles).

Average wind speed

The mean monthly wind speed over the year (in meters per second)

Average monthly wind speed in Al Salmiya, Kuwait

Feel free to add this climate graph to your website. Click the copy button above.

* Data from: Kuwait, Kuwait (16 KM, 9 Miles).

Weather Forecasts for Al Salmiya

Tue   Apr 16
30°C | 20°C
NW 22 km/h
almost clear and no rain

almost clear and no rain

Wed   Apr 17
34°C | 21°C
NW 18 km/h
clear and no rain

clear and no rain

Thu   Apr 18
34°C | 22°C
E 18 km/h
clear and no rain

clear and no rain

The best time of year to visit Al Salmiya in Kuwait

During the months of February, March, November and December you are most likely to experience good weather with pleasant average temperatures that fall between 20°C and 26°C.

Other facts from our historical weather data:

  • Which is the warmest month in Al Salmiya?
    August has an average maximum temperature of 41°C and is the warmest month of the year.
  • Which is the coldest month in Al Salmiya?
    The coldest month is January with an average maximum temperature of 18°C.
  • Which is the wettest month in Al Salmiya?
    November tops the wettest month list with 33 mm of rainfall.
  • Which is the driest month in Al Salmiya?
    July is the driest month with 0 mm of precipitation.
  • Which is the sunniest month in Al Salmiya?
    July is the sunniest month with an average of 307 hours of sunshine.

  • No idea where to travel to this year? We have a tool that recommends destinations based on your ideal conditions. Find out where to go with our weather planner.