ClimateForecastAprilMay >>

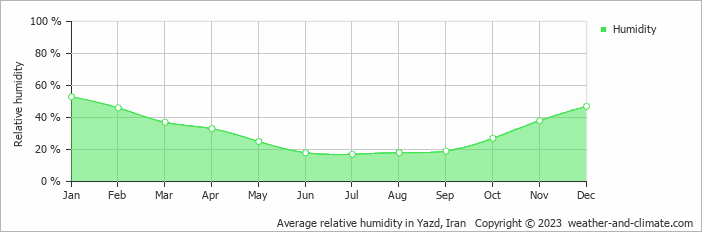
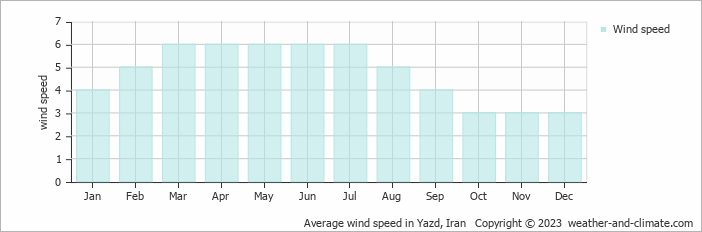
Climate in Yazd, Iran

The graphs below show the monthly weather averages over the year.

Average day and night temperature

The mean minimum and maximum temperatures over the year.

Average monthly minimum and maximum temperature in Yazd, Iran

Feel free to add this climate graph to your website. Click the copy button above.

Monthly hours of sunshine

The average monthly total hours of sunshine over the year

Average monthly hours of sunshine in Yazd, Iran

Feel free to add this climate graph to your website. Click the copy button above.

Monthly precipitation

The mean monthly precipitation over the year, including rain, snow, hail etc.

Average monthly rainfall, snow, precipitation in Yazd, Iran

Feel free to add this climate graph to your website. Click the copy button above.

Monthly rainy days

The average number of days each month with rain, snow, hail etc.

Average monthly rainy days in Yazd, Iran

Feel free to add this climate graph to your website. Click the copy button above.

Average humidity

The mean monthly relative humidity over the year

Average monthly relative humidity in Yazd, Iran

Feel free to add this climate graph to your website. Click the copy button above.

Average wind speed

The mean monthly wind speed over the year (in meters per second)

Average monthly wind speed in Yazd, Iran

Feel free to add this climate graph to your website. Click the copy button above.

Weather Forecasts for Yazd

Thu   Apr 18
21°C | 10°C
NW 25 km/h
0.7 mm
partly cloudy and small chance of slight rain

partly cloudy and small chance of slight rain

Fri   Apr 19
25°C | 11°C
SE 14 km/h
clear and no rain

clear and no rain

Sat   Apr 20
24°C | 14°C
W 18 km/h
partly cloudy and no rain

partly cloudy and no rain

The best time of year to visit Yazd in Iran

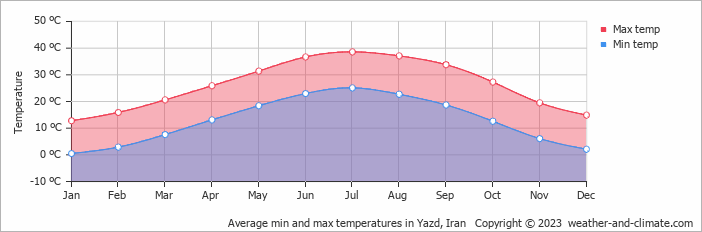
During the months of March and April you are most likely to experience good weather with pleasant average temperatures that fall between 20°C and 26°C.

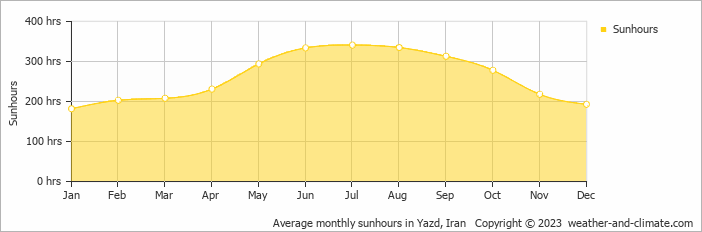
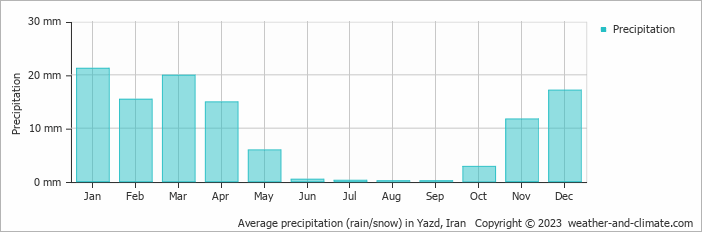
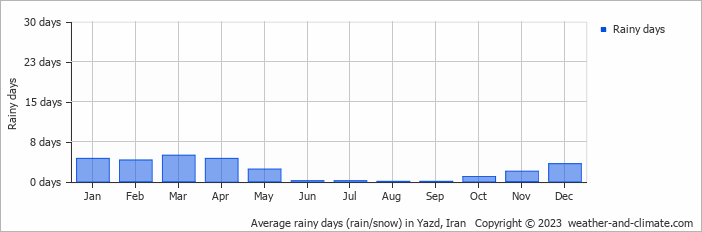
Other facts from our historical weather data:

  • Which is the warmest month in Yazd?
    July has an average maximum temperature of 39°C and is the warmest month of the year.
  • Which is the coldest month in Yazd?
    The coldest month is January with an average maximum temperature of 13°C.
  • Which is the wettest month in Yazd?
    January tops the wettest month list with 21 mm of rainfall.
  • Which is the driest month in Yazd?
    August is the driest month with 0 mm of precipitation.
  • Which is the sunniest month in Yazd?
    July is the sunniest month with an average of 341 hours of sunshine.

  • No idea where to travel to this year? We have a tool that recommends destinations based on your ideal conditions. Find out where to go with our weather planner.