ClimateForecastAprilMay >>

Climate in Tauranga (Bay of Plenty), New Zealand

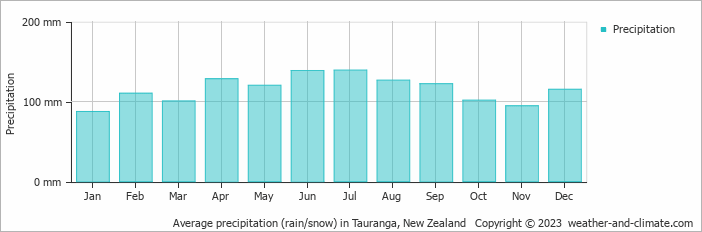
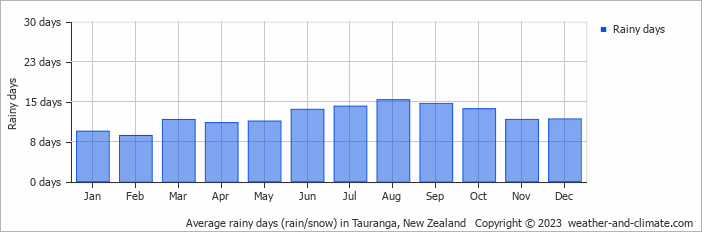
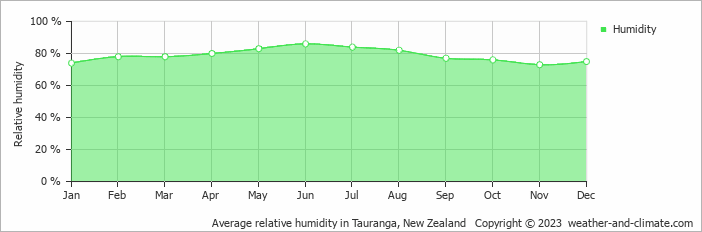
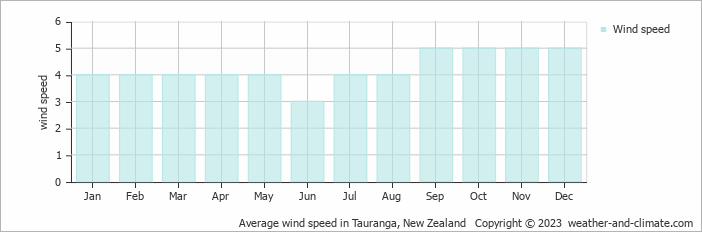
The graphs below show the monthly weather averages over the year.

Average day and night temperature

The mean minimum and maximum temperatures over the year.

Average monthly minimum and maximum temperature in Tauranga, New Zealand

Feel free to add this climate graph to your website. Click the copy button above.

Monthly hours of sunshine

The average monthly total hours of sunshine over the year

Average monthly hours of sunshine in Tauranga, New Zealand

Feel free to add this climate graph to your website. Click the copy button above.

Daily percent of sunshine

The mean percent of hours of sunhours during the day over the year

Average monthly percentage of sunshine in Tauranga, New Zealand

Feel free to add this climate graph to your website. Click the copy button above.

Average water temperature

The mean water temperature over the year.

Average monthly water temperature in Tauranga, New Zealand

Feel free to add this climate graph to your website. Click the copy button above.

Monthly precipitation

The mean monthly precipitation over the year, including rain, snow, hail etc.

Average monthly rainfall, snow, precipitation in Tauranga, New Zealand

Feel free to add this climate graph to your website. Click the copy button above.

Monthly rainy days

The average number of days each month with rain, snow, hail etc.

Average monthly rainy days in Tauranga, New Zealand

Feel free to add this climate graph to your website. Click the copy button above.

Average humidity

The mean monthly relative humidity over the year

Average monthly relative humidity in Tauranga, New Zealand

Feel free to add this climate graph to your website. Click the copy button above.

Average wind speed

The mean monthly wind speed over the year (in meters per second)

Average monthly wind speed in Tauranga, New Zealand

Feel free to add this climate graph to your website. Click the copy button above.

Weather Forecasts for Tauranga

Fri   Apr 19
21°C | 10°C
W 18 km/h
1.2 mm
broken clouds and slight rain

broken clouds and slight rain

Sat   Apr 20
17°C | 13°C
N 14 km/h
23 mm
overcast and heavy rain

overcast and heavy rain

Sun   Apr 21
21°C | 10°C
SW 18 km/h
1.4 mm
partly cloudy and  chance of rain

partly cloudy and chance of rain

The best time of year to visit Tauranga in New Zealand

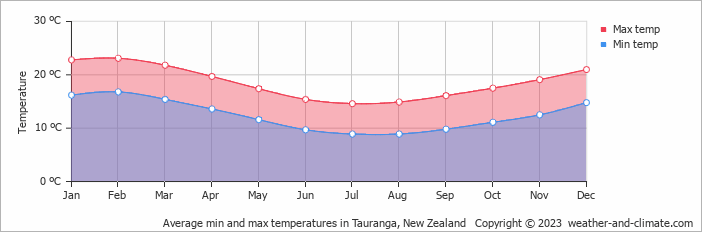
During the months of January, February, March and December you are most likely to experience good weather with pleasant average temperatures that fall between 20°C and 26°C.

Other facts from our historical weather data:

  • Which is the warmest month in Tauranga?
    February has an average maximum temperature of 23°C and is the warmest month of the year.
  • Which is the coldest month in Tauranga?
    The coldest month is August with an average maximum temperature of 15°C.
  • Which is the wettest month in Tauranga?
    July tops the wettest month list with 139 mm of rainfall.
  • Which is the driest month in Tauranga?
    January is the driest month with 87 mm of precipitation.
  • Which is the sunniest month in Tauranga?
    January is the sunniest month with an average of 262 hours of sunshine.

  • No idea where to travel to this year? We have a tool that recommends destinations based on your ideal conditions. Find out where to go with our weather planner.