ClimateForecastAprilMay >>

Climate in Riyaq (Beirut Governorate), Lebanon

The graphs below show the monthly weather averages over the year.

Average day and night temperature

The mean minimum and maximum temperatures over the year.

Average monthly minimum and maximum temperature in Riyaq, Lebanon

Feel free to add this climate graph to your website. Click the copy button above.

Monthly precipitation

The mean monthly precipitation over the year, including rain, snow, hail etc.

Average monthly rainfall, snow, precipitation in Riyaq, Lebanon

Feel free to add this climate graph to your website. Click the copy button above.

Monthly rainy days

The average number of days each month with rain, snow, hail etc.

Average monthly rainy days in Riyaq, Lebanon

Feel free to add this climate graph to your website. Click the copy button above.

Average humidity

The mean monthly relative humidity over the year

Average monthly relative humidity in Riyaq, Lebanon

Feel free to add this climate graph to your website. Click the copy button above.

Weather Forecasts for Riyaq

Fri   Apr 19
23°C | 8°C
SW 14 km/h
clear and no rain

clear and no rain

Sat   Apr 20
24°C | 10°C
SW 11 km/h
broken clouds and no rain

broken clouds and no rain

Sun   Apr 21
21°C | 5°C
SW 14 km/h
clear and no rain

clear and no rain

The best time of year to visit Riyaq in Lebanon

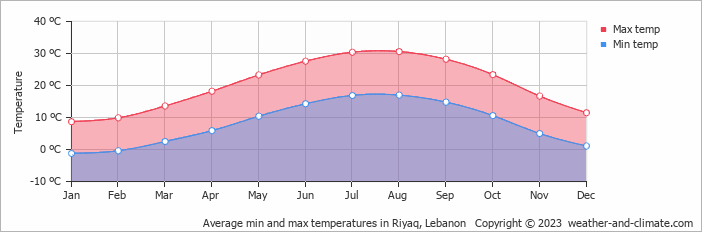
During the months of May and October you are most likely to experience good weather with pleasant average temperatures that fall between 20°C and 26°C.

Other facts from our historical weather data:

  • When is summer in Riyaq?
    The hottest season / summer takes place in June, July, August and September.
  • Does Riyaq have a dry season?
    Yes, the months of June, July, August and September are very dry.
  • Which is the warmest month in Riyaq?
    August has an average maximum temperature of 31°C and is the warmest month of the year.
  • Which is the coldest month in Riyaq?
    The coldest month is January with an average maximum temperature of 9°C.
  • Which is the wettest month in Riyaq?
    February tops the wettest month list with 102 mm of rainfall.
  • Which is the driest month in Riyaq?
    July is the driest month with 1 mm of precipitation.

  • No idea where to travel to this year? We have a tool that recommends destinations based on your ideal conditions. Find out where to go with our weather planner.