ClimateForecastAprilMay >>

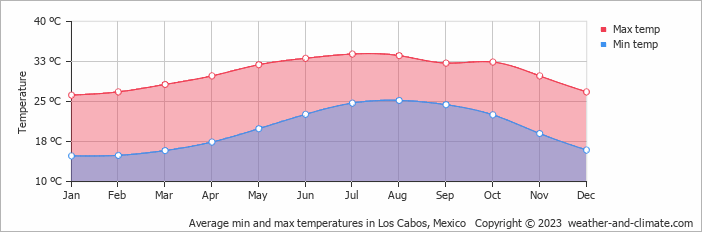
Climate in Los Cabos, Mexico

The graphs below show the monthly weather averages over the year.

Average day and night temperature

The mean minimum and maximum temperatures over the year.

Average monthly minimum and maximum temperature in Los Cabos, Mexico

Feel free to add this climate graph to your website. Click the copy button above.

Monthly precipitation

The mean monthly precipitation over the year, including rain, snow, hail etc.

Average monthly rainfall, snow, precipitation in Los Cabos, Mexico

Feel free to add this climate graph to your website. Click the copy button above.

Monthly rainy days

The average number of days each month with rain, snow, hail etc.

Average monthly rainy days in Los Cabos, Mexico

Feel free to add this climate graph to your website. Click the copy button above.

Weather Forecasts for Los Cabos

Tue   Apr 16
30°C | 18°C
SE 22 km/h
broken clouds and no rain

broken clouds and no rain

Wed   Apr 17
30°C | 20°C
SE 22 km/h
broken clouds and no rain

broken clouds and no rain

Thu   Apr 18
32°C | 18°C
S 29 km/h
clear and no rain

clear and no rain

The best time of year to visit Los Cabos in Mexico

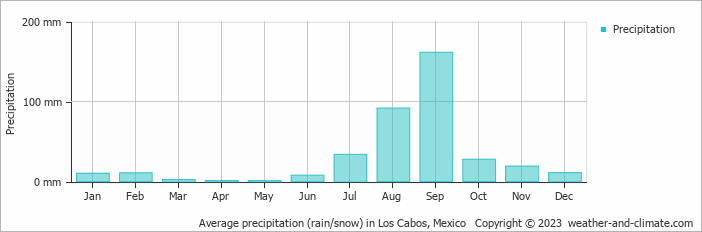
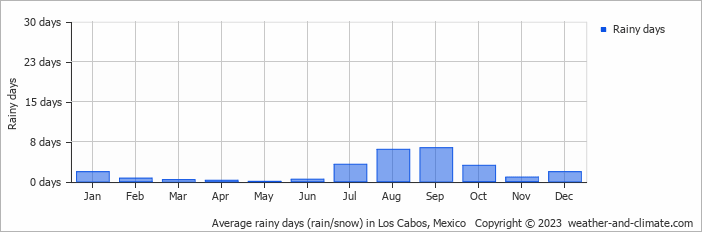
The best time to visit is during the drier months: January, February, March, April, May, June, July, October, November and December.

Other facts from our historical weather data:

  • Which is the warmest month in Los Cabos?
    July has an average maximum temperature of 34°C and is the warmest month of the year.
  • Which is the coldest month in Los Cabos?
    The coldest month is January with an average maximum temperature of 26°C.
  • Which is the wettest month in Los Cabos?
    September tops the wettest month list with 161 mm of rainfall.
  • Which is the driest month in Los Cabos?
    April is the driest month with 1 mm of precipitation.

  • No idea where to travel to this year? We have a tool that recommends destinations based on your ideal conditions. Find out where to go with our weather planner.