ClimateForecastAprilMay >>

Climate in Kingston (Ontario), Canada

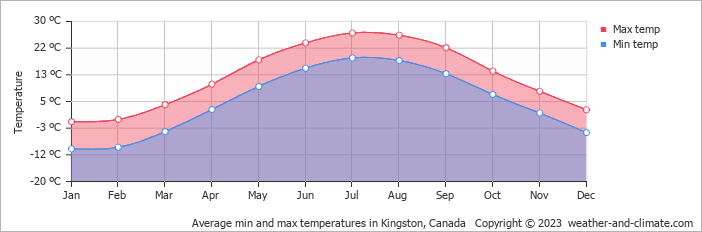
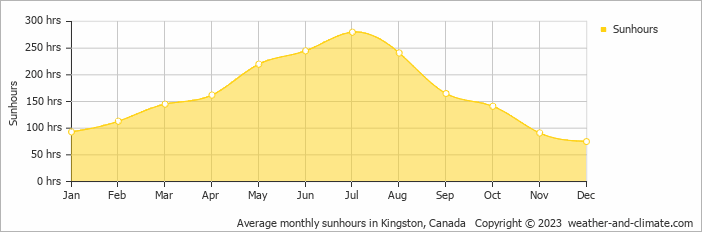
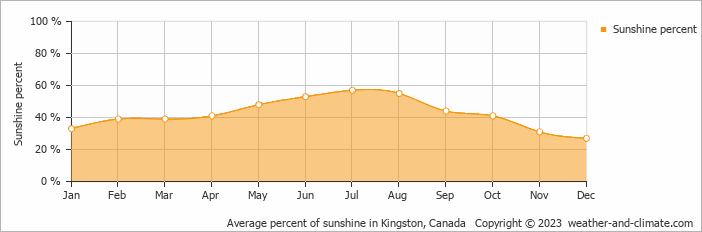
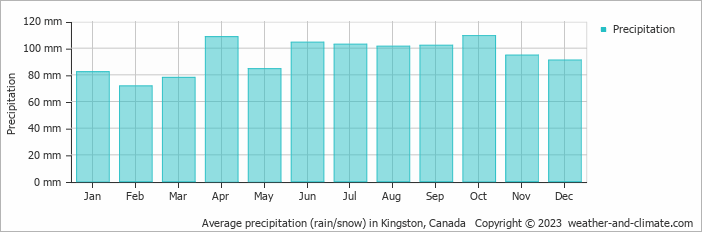
The graphs below show the monthly weather averages over the year.

Average day and night temperature

The mean minimum and maximum temperatures over the year.

Average monthly minimum and maximum temperature in Kingston, Canada

Feel free to add this climate graph to your website. Click the copy button above.

Monthly hours of sunshine

The average monthly total hours of sunshine over the year

Average monthly hours of sunshine in Kingston, Canada

Feel free to add this climate graph to your website. Click the copy button above.

Daily percent of sunshine

The mean percent of hours of sunhours during the day over the year

Average monthly percentage of sunshine in Kingston, Canada

Feel free to add this climate graph to your website. Click the copy button above.

Monthly precipitation

The mean monthly precipitation over the year, including rain, snow, hail etc.

Average monthly rainfall, snow, precipitation in Kingston, Canada

Feel free to add this climate graph to your website. Click the copy button above.

Monthly rainy days

The average number of days each month with rain, snow, hail etc.

Average monthly rainy days in Kingston, Canada

Feel free to add this climate graph to your website. Click the copy button above.

Weather Forecasts for Kingston

Tue   Apr 16
12°C | 5°C
SW 22 km/h
almost clear and no rain

almost clear and no rain

Wed   Apr 17
12°C | 3°C
NE 25 km/h
0.8 mm
broken clouds and small chance of slight rain

broken clouds and small chance of slight rain

Thu   Apr 18
11°C | 7°C
SE 22 km/h
11 mm
overcast and heavy rain

overcast and heavy rain

The best time of year to visit Kingston in Canada

During the months of June, August and September you are most likely to experience good weather with pleasant average temperatures that fall between 20°C and 26°C.

Other facts from our historical weather data:

  • When is winter in Kingston?
    The coldest season / winter is in the following months: January, February and December.
  • Which is the warmest month in Kingston?
    July has an average maximum temperature of 26°C and is the warmest month of the year.
  • Which is the coldest month in Kingston?
    The coldest month is January with an average maximum temperature of -1°C.
  • Which is the wettest month in Kingston?
    October tops the wettest month list with 109 mm of rainfall.
  • Which is the driest month in Kingston?
    February is the driest month with 72 mm of precipitation.
  • Which is the sunniest month in Kingston?
    July is the sunniest month with an average of 280 hours of sunshine.

  • No idea where to travel to this year? We have a tool that recommends destinations based on your ideal conditions. Find out where to go with our weather planner.