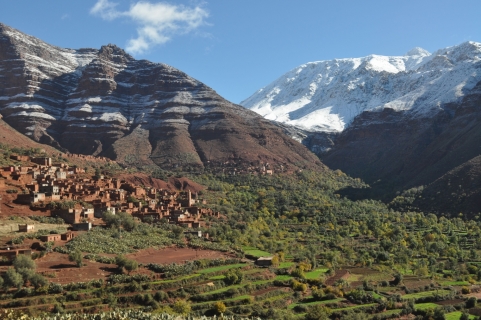
 The Atlas Mountains in Morocco
This mountain range is the second highest mountains in the world and is certainly one of the most natural and wonderful mountains you could ever visit. One for the bucket list for sure.
Dakhla-Oued Ed-Dahab is a region in Morocco. Many people wonder what the weather conditions are in Dakhla-Oued Ed-Dahab over the year. What is the best time to visit Dakhla-Oued Ed-Dahab?
This page shows the average weather conditions by month in Dakhla-Oued Ed-Dahab over the year in: January, February, March, April, May, June, July, August, September, October, November, December.
In January the weather in Dakhla-Oued Ed-Dahab is generally excellent. In Dakhla you can expect pleasant maximum average daytime temperatures around 22°C (72°F) and nighttime temperatures around 15°C (59°F). On average, this month is the coldest month of the year in Dakhla-Oued Ed-Dahab.
Find more detailed climate information for Dakhla-Oued Ed-Dahab in January here.
Perfect weather is subjective. On this map perfect weather has been defined with temperatures between 20°C (68°F) and 29°C (84°F) and not too much precipitation (less than 90 mm (3.5 in) a month).
Perfect weather is subjective. On this map perfect weather has been defined with temperatures between 20°C (68°F) and 29°C (84°F) and not too much precipitation (less than 90 mm (3.5 in) a month).
Perfect weather is subjective. On this map perfect weather has been defined with temperatures between 20°C (68°F) and 29°C (84°F) and not too much precipitation (less than 90 mm (3.5 in) a month).
Perfect weather is subjective. On this map perfect weather has been defined with temperatures between 20°C (68°F) and 29°C (84°F) and not too much precipitation (less than 90 mm (3.5 in) a month).
Perfect weather is subjective. On this map perfect weather has been defined with temperatures between 20°C (68°F) and 29°C (84°F) and not too much precipitation (less than 90 mm (3.5 in) a month).
Perfect weather is subjective. On this map perfect weather has been defined with temperatures between 20°C (68°F) and 29°C (84°F) and not too much precipitation (less than 90 mm (3.5 in) a month).
Perfect weather is subjective. On this map perfect weather has been defined with temperatures between 20°C (68°F) and 29°C (84°F) and not too much precipitation (less than 90 mm (3.5 in) a month).
Perfect weather is subjective. On this map perfect weather has been defined with temperatures between 20°C (68°F) and 29°C (84°F) and not too much precipitation (less than 90 mm (3.5 in) a month).
In September the weather in Dakhla-Oued Ed-Dahab is generally excellent. In Dakhla you can expect warm maximum average daytime temperatures around 26°C (79°F) and nighttime temperatures around 21°C (70°F). On average, this month is one of the warmest months of the year in Dakhla-Oued Ed-Dahab. So be prepared and make sure to dress lightly.
Find more detailed climate information for Dakhla-Oued Ed-Dahab in September here.
Perfect weather is subjective. On this map perfect weather has been defined with temperatures between 20°C (68°F) and 29°C (84°F) and not too much precipitation (less than 90 mm (3.5 in) a month).
Perfect weather is subjective. On this map perfect weather has been defined with temperatures between 20°C (68°F) and 29°C (84°F) and not too much precipitation (less than 90 mm (3.5 in) a month).
Perfect weather is subjective. On this map perfect weather has been defined with temperatures between 20°C (68°F) and 29°C (84°F) and not too much precipitation (less than 90 mm (3.5 in) a month).
Perfect weather is subjective. On this map perfect weather has been defined with temperatures between 20°C (68°F) and 29°C (84°F) and not too much precipitation (less than 90 mm (3.5 in) a month).
Need travel inspiration? Check out our bucket list articles and be inspired.
The Atlas Mountains in Morocco
This mountain range is the second highest mountains in the world and is certainly one of the most natural and wonderful mountains you could ever visit. One for the bucket list for sure.

 Where to Go for Christmas: Sun, Value and Fewer Crowds
Where can you find warm Christmas weather without peak-season prices and huge crowds? Compare Marsa Alam, The Gambia, Vietnam, Agadir and Cap Skirring.

 Warm Days, Cool Nights: 8 Destinations With the Perfect Day-Night Temperature
Prefer warm sunny days but cool evenings? Compare eight destinations with daytime temperatures of around 25–30°C, cooler nights, low rainfall and plenty of sunshine.
 Morocco in October: Where Is the Best Weather?
Compare Morocco weather in October for Marrakesh, Agadir, Essaouira, Fez and Merzouga to find the warmest, driest and sunniest places.