Average monthly snow and rainfall in Laugar
The mean monthly precipitation over the year in Laugar (North Iceland), including rain, snow, hail.
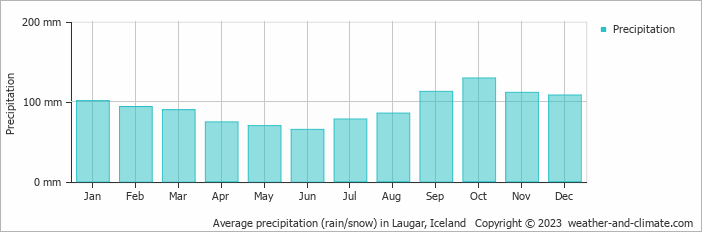
- A lot of rain (rainy season) falls in the months: January, September, October, November and December.
- On average, October is the wettest month with 129 mm of precipitation.
- On average, June is the driest month with 65 mm of precipitation.
- The average amount of annual precipitation is 1116 mm.
Weather Forecasts for Laugar
Sat May 04
8°C | 1°C
N  11 km/h
11 km/halmost clear and no rain
Sun May 05
8°C | 3°C
NW 7 km/h
7 km/hovercast and no rain
Mon May 06
8°C | -1°C
S 7 km/h
7 km/hclear and no rain


