Average monthly snow and rainfall in Burgerbrug
The mean monthly precipitation over the year in Burgerbrug (Noord-Holland), including rain, snow, hail.
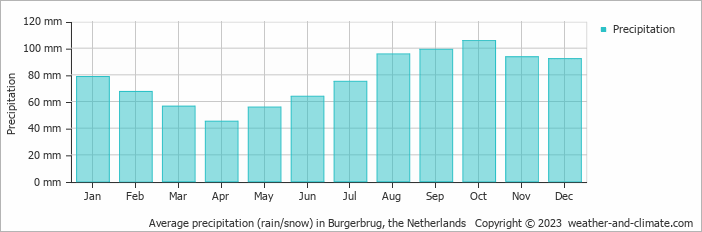
- Most rainfall (rainy season) is seen in October.
- On average, October is the wettest month with 106 mm of precipitation.
- On average, April is the driest month with 45 mm of precipitation.
- The average amount of annual precipitation is 928 mm.
Forecast for Burgerbrug
Mon May 06
19°C | 8°C
NE  18 km/h
18 km/hpartly cloudy and no rain
Tue May 07
17°C | 9°C
NW 14 km/h
14 km/hpartly cloudy and no rain
Wed May 08
16°C | 9°C
N 18 km/h
18 km/h0.7 mm
broken clouds and chance of rain


