Average monthly snow and rainfall in Bad Berka
The mean monthly precipitation over the year in Bad Berka (Thuringia), including rain, snow, hail.
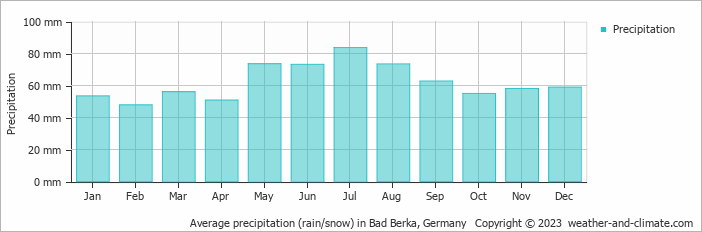
- On average, July is the wettest month with 84 mm of precipitation.
- On average, February is the driest month with 48 mm of precipitation.
- The average amount of annual precipitation is 746 mm.
Weather Forecasts for Bad Berka
Fri May 03
15°C | 11°C
SW  22 km/h
22 km/hbroken clouds and no rain
Sat May 04
16°C | 9°C
SE 11 km/h
11 km/hovercast and no rain
Sun May 05
17°C | 11°C
SW 25 km/h
25 km/h1.7 mm
partly cloudy and rain