Aguas Dulces Precipitation: Average Monthly Rainfall and Snowfall
This graph shows the average amount of rainfall per month in Aguas Dulces (Rocha). The numbers are calculated over a 30-year period to provide a reliable average.
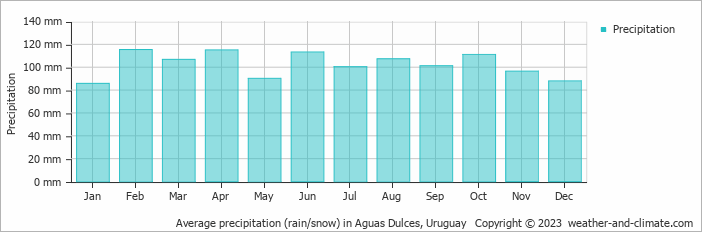
- A lot of rain (rainy season) falls in the months: February, March, April, June, July, August, September and October.
- On average, February is the wettest month with 115 mm of precipitation.
- On average, January is the driest month with 86 mm of precipitation.
- The average amount of annual precipitation is 1230 mm.
Current rainfall in Aguas Dulces
Fri Sep 20
24°C | 10°C
SW  22 km/h
22 km/hpartly cloudy and no rain
Sat Sep 21
23°C | 9°C
NE 25 km/h
25 km/hclear and no rain
Sun Sep 22
26°C | 13°C
N 22 km/h
22 km/hbroken clouds and no rain


