Average monthly rainy days in Wadi Musa
The number of days each month with rain, snow and hail in Wadi Musa (), Jordan.
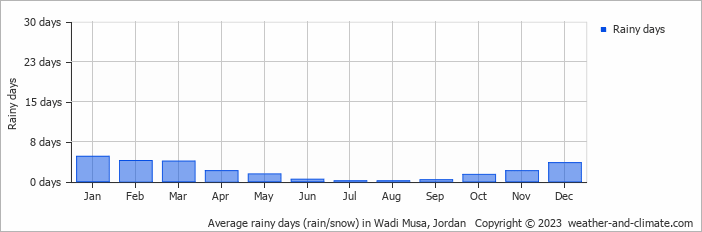
- Wadi Musa has dry periods in April, May, June, July, August, September, October and November.
- On average, January is the most rainy with 4 days of rain/snow.
- On average, July is the driest month with 0 rainy days.
- The average annual number of rainy days is 23.
Forecast for Wadi Musa
Mon May 06
20°C | 11°C
W  25 km/h
25 km/h1.2 mm
partly cloudy and small chance of rain
Tue May 07
21°C | 11°C
NW 14 km/h
14 km/hclear and no rain
Wed May 08
25°C | 13°C
NW 11 km/h
11 km/halmost clear and no rain